Will Pearre

Course: Precalculus, MATH-130
Professor: Janice Stencil
Assignment Title: Salinity
Assignment Details
For this assignment I was tasked with determining a quadratic, cubic, exponential, and sinusoidal model for the salinity of the Chesapeake Bay. Salinity is the concentration of salt in a body of water and is typically measured in parts per thousand (abbreviated ppt). I was given three values for the salinity at three different points in time, which are provided in the table below. Using this information, I was able to make an equation for each mathematical model.
For each model, I started with the general form of the function and substituted the given information into the equation. The general form of each model where S is equal to salinity and t is equal to time is as follows:
Quadratic: S(t) = at2+bt+c
Cubic: S(t) = at3+bt2+ct+d
Exponential: S(t) = aebt+c
Sinusoidal: S(t) = acos(bt)+d
Once I solved for the unknown variables, I had an equation that I could use to predict future values for salinity and make a graph to visualize the data.
Application
I am interested in pursuing a STEM based major. This assignment provided me with the opportunity to calculate several equations, interpret data, and graph my results. These skills will serve as a solid foundation as I continue to build upon them in calculus this semester. The process used to solve equations and make conclusions in this assignment will be necessary as I encounter similar problems in mathematics.
Another skill I developed while completing this assignment was the ability to effectively communicate mathematical analysis in a formal report. I can apply this knowledge when I take chemistry or other lab sciences in the future. The ability to present data in a logical and understandable way will be necessary as I complete other assignments in my classes.
Results/Conclusions
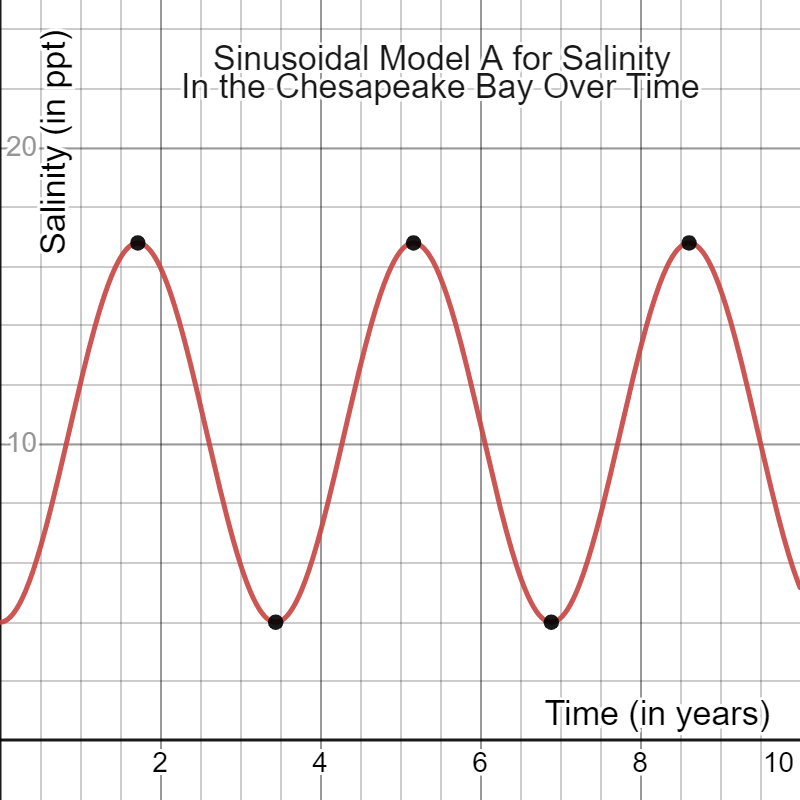
The final part of this assignment gave the actual value for salinity on the third year, which was 5.9 ppt. According to this new information, I was able to determine that Equation A of the sinusoidal model was the most accurate.
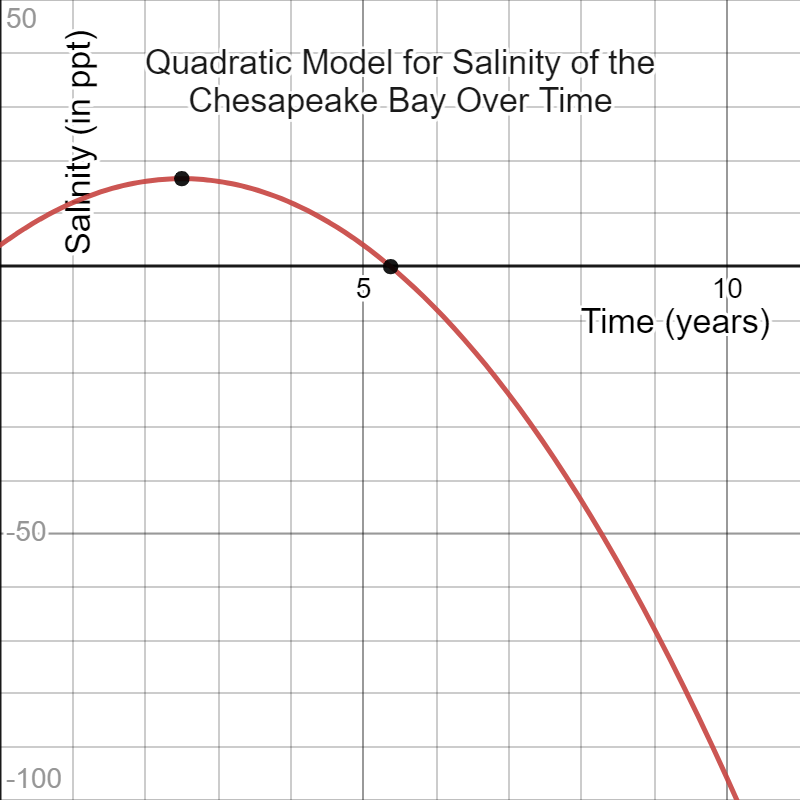
Quadratic:
Equation: S(t)=-2t2+10t+4
Prediction on the third year: 16 ppt.
Graph: Parabola- increasing to a point and then decreasing indefinitely
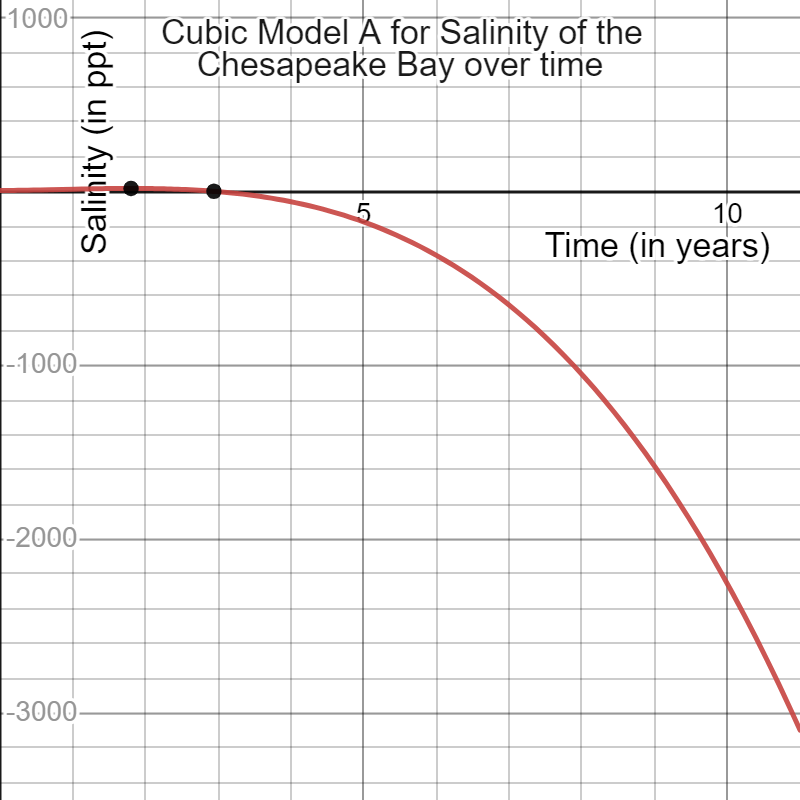
Cubic:
Equation A: S(t)=-3t3+7t2+4t+4
Prediction on the third year: -2 ppt.
Graph: Decreases quickly over time
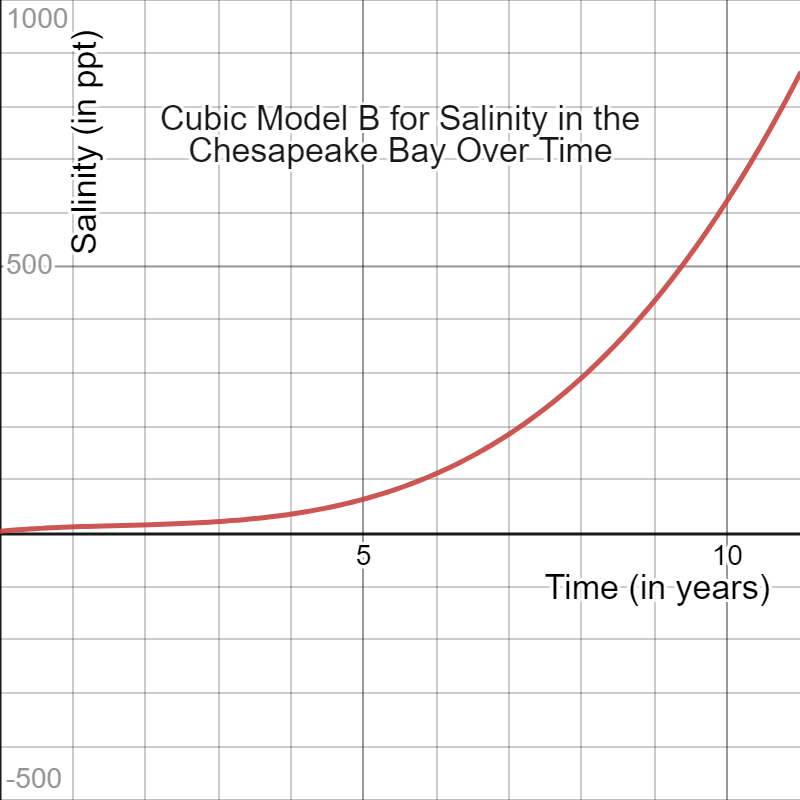
Equation B: S(t)=t3-5t2+12t+4
Prediction on the third year: 22 ppt.
Graph: Increases quickly over time
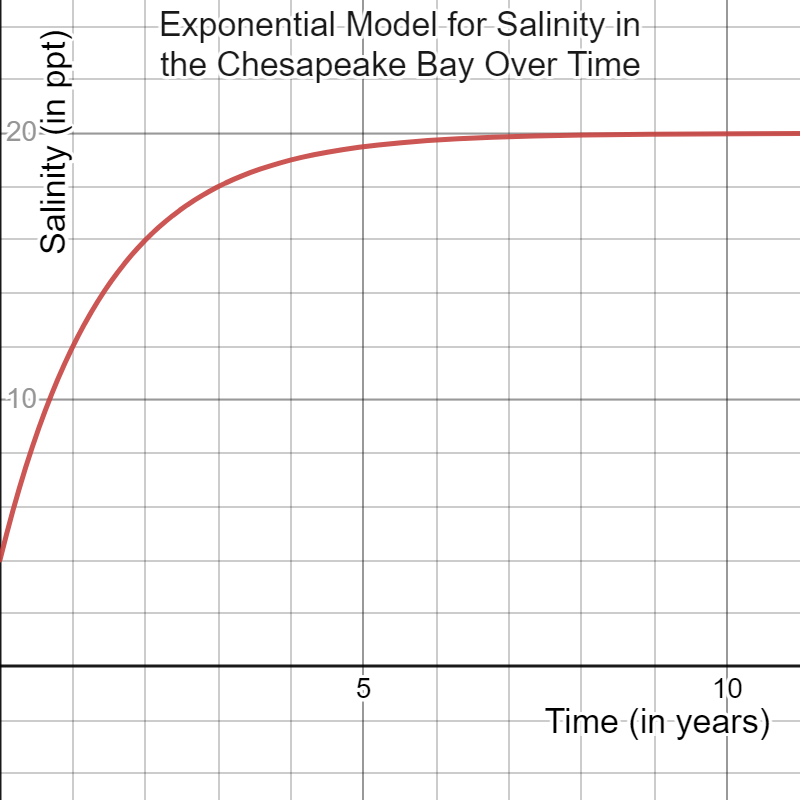
Exponential:
Equation: S(t)=-16eln(½)t+20
Prediction on the third year: 18 ppt.
Graph: Increases infinitely but never reaches 20 ppt.
Sinusoidal:
Equation A: S(t)=-32/5cos(1.823t)+52/5
Prediction on the third year: 6 ppt.
Graph: Fluctuates direction periodically
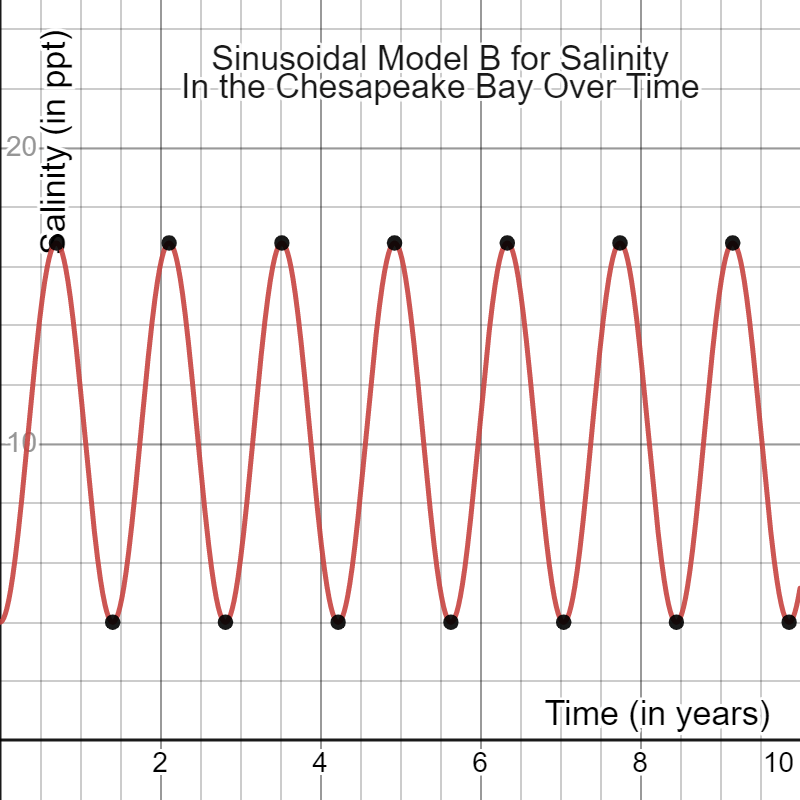
Equation B: S(t)=-32/5cos(4.459t)+52/5
Prediction on the third year: 6 ppt.
Graph: Fluctuates direction frequently
Challenges and Successes
A challenge I encountered while working on this assignment was the fact that it was exclusively online. As a result, there was less interaction with my professor. This made asking questions difficult as I would have to wait for a published office hour or a reply via email. Despite the challenge, Professor Stencil was interactive and quick to respond.
There were technical challenges with the visibility of the equations and values that I turned in. This provided additional stress as I had to figure out why the equations were not showing and how I could get my professor to see them. Thankfully, Professor Stencil and I were able to troubleshoot the issue and she was able to see my calculations.
The biggest challenge I faced was that I discovered an error in the assignment. The assignment indicated that there was only one correct graph for the sinusoidal model, but the answer I calculated indicated that there were two. I contacted Professor Stencil, and we were able to collaborate and agree that there were two correct graphs.
Additional Media